

Highlights
- July 2025 marks a two-year streak of rent decline for 0-2 bedroom properties since trend data began in 2020. Asking rents dipped by $43 (-2.5%) year over year.
- The median asking rent in the 50 largest metros registered at $1,712, $47 (-2.7%) lower than its August 2022 peak but $254 (17.4%) higher than the pre-pandemic level.
- Median rent declined in all size categories: studio: $1,428, down $21 (-1.4%) year over year; 1-bed: $1,590, down $45 (-2.8%) year over year; 2-bed: $1,899, down $45 (-2.3%) year over year.
- Multifamily supply is pulling back amid growing headwinds, such as tariffs and compressed profits, with Orlando, FL, Philadelphia, PA, and San Antonio, TX, beginning to show signs of disrupted permitting activity.
In July 2025, U.S. median rent recorded its 24th consecutive year-over-year decline, marking a two-year streak of downward momentum. Rent for 0-2 bedroom properties across the 50 largest metropolitan areas dropped by 2.5% compared with the previous year, with the median asking rent at $1,712—just $1 more than the prior month.
While this is the fifth consecutive month that rents have trended up—reflecting a typical seasonal uptick as rents tend to rise in the spring and summer, the monthly rent growth has been consistently slower than the same time last year, with a growing year-over-year decline, suggesting a softer rental market. Specifically, the median asking rent was up by 1.2% year to date, slower than the 2.8% seen between January and July 2024. This comes following a quarter in which the rate of renters among U.S. households was at 35%, the highest in nearly six years, and the rental vacancy rate edged down to 7%.
Figure 1: Rents Decline Again, but Nationwide Rent Is 2.7% Below 2022 Peak
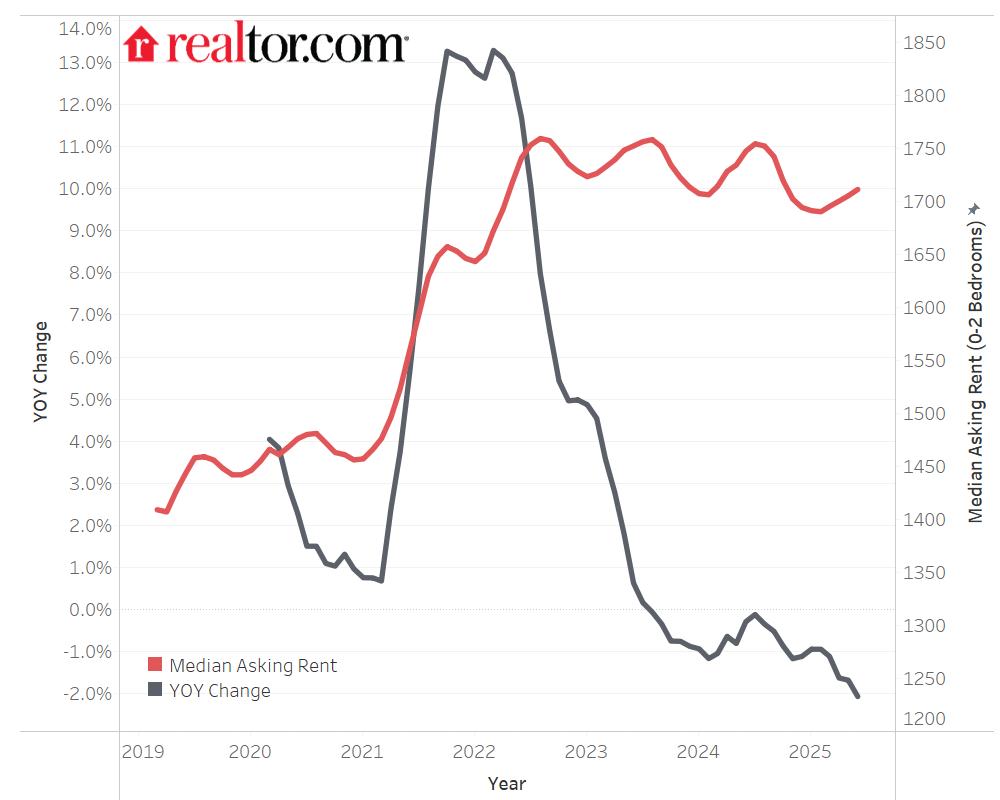
Despite 24 consecutive months of year-over-year decline, the U.S. median rent was just $48 (-2.7%) less than the peak seen in August 2022. Notably, it was still $268 (18.6%) higher than the same time in 2019 (pre-pandemic), but this increase is somewhat lower than what has occurred in overall consumer prices (up 26% in the six years ending in June 2025) and pales in comparison with the 52.3% increase in median price per square foot of for-sale home listings in the six years ending in July 2025.
All units saw rent declines
In July, the median asking rent for two-bedroom units dropped 2.3% year over year, marking the 26th consecutive month of annual declines. The median rent for two bedrooms was $1,898 nationally, $61 (-3.1%) lower than the peak seen in August 2022. Nevertheless, larger unit rents had the highest growth rate over the past six years, up by $303 (19%).
The rent for one-bedroom units slipped 2.8% in July 2025 on a year-over-year basis, standing at $1,590, and was the 26th consecutive month of annual declines. It was $68 (-4.1%) lower than the peak observed during August 2022, but still $215 (15.6%) higher than in July 2019.
In July 2025, the median asking rent for studios fell by 1.4%, marking the 23rd consecutive month of annual declines. The median rent of studios was $1,428 in July, down by $59 (-4%) from its peak seen in October 2022. Nevertheless, the median asking rent for studios was still $170 (13.5%) higher than six years ago.
Figure 2: All Units Saw Rent Declines
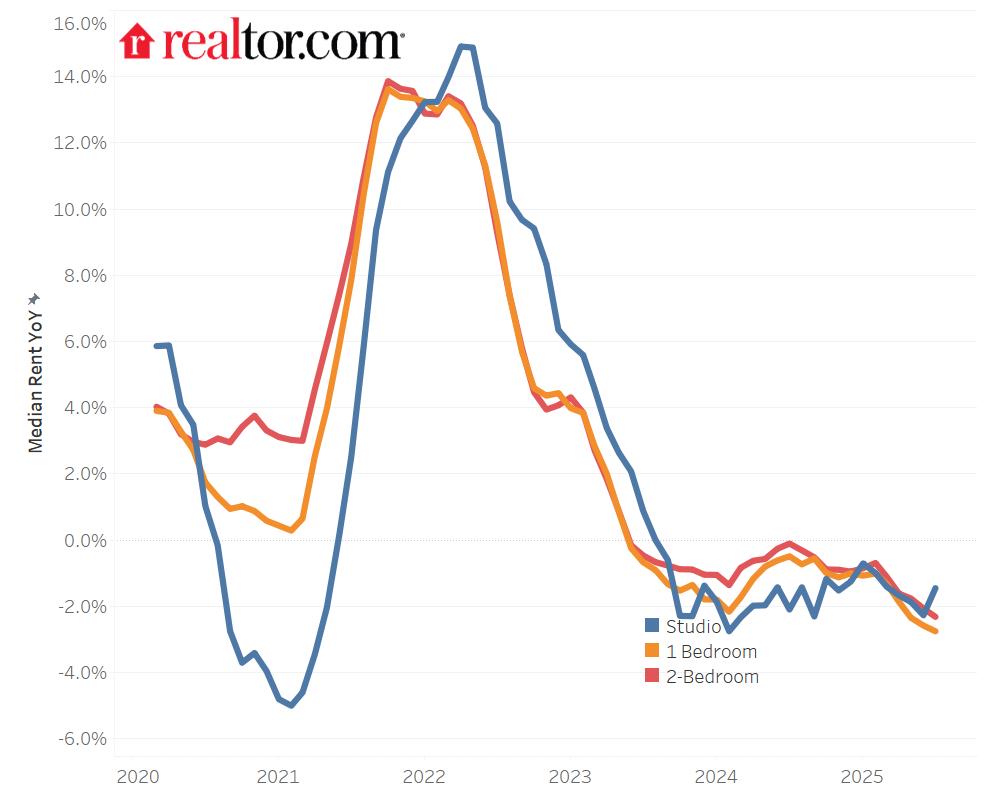
Table 1: National Rents by Unit Size
| Unit Size | Median Rent | Rent YoY | Consecutive Months of Decline | Total Decline From Peak | Rent Change – 6 Years |
| Overall | $1,712 | -2.5% | 24 | -2.7% | 17.4% |
| Studio | $1,428 | -1.4% | 23 | -4.0% | 13.5% |
| 1-Bedroom | $1,590 | -2.8% | 26 | -4.1% | 15.6% |
| 2-Bedroom | $1,898 | -2.3% | 26 | -3.1% | 19.0% |
Multifamily supply pulls back amid growing headwinds
In June 2025, multifamily completions for buildings with two or more units fell sharply by 38.1%, dropping from a seasonally adjusted annual rate of 656,000 units in June 2024 to 406,000 units—a significant pullback in new rental supply. While we anticipated some decline in multifamily completions in 2025 as the market grappled with a full pipeline and rent headwinds, we have seen a greater-than-expected slowdown. Regionally, the Midwest experienced the steepest year-over-year decline at -55.7%, followed by the South (-33.5%), Northeast (-33%), and West (-28.9%).
The recent slowdown in national multifamily completions signals early signs of strain in the rental housing pipeline. As developers grapple with rising construction costs—exacerbated by new tariffs—and shrinking profit margins amid softening rents, many are growing more cautious about starting new projects. This pullback might now be reflected in local permitting data, where some markets that had previously experienced steady growth are showing signs of notable decline.
To identify where developers might be pulling back, we compare quarter-over-quarter changes in multifamily permitting activity. Specifically, we calculate the change in permits from Q1 to Q2 of 2025 and compare it with the Q1-to-Q2 change observed in 2022, 2023, and 2024. This approach helps isolate whether each metro’s typical seasonal permitting trend was disrupted—an early signal of where supply pipelines might be weakening and deeper shortfalls could emerge.
Specifically, permitting activity in Orlando, FL, Philadelphia, PA, and San Antonio, TX, recorded their first quarterly permitting declines since 2022—an early indication that developers might be pulling back in response to broader economic headwinds. In addition, Charlotte, NC, and Las Vegas, NV, saw the largest quarterly decline since 2022. While permitting activity in San Francisco grew, as it tends to this time of year, it saw the slowest quarterly growth between the first two quarters since 2022.
Table 2: Markets With Disrupted Permitting Trends
| Market | 5 Units or More, 2025Q2 | % Diff 2025Q2 vs. 2025Q1 | % Diff 2024Q2 vs. 2024Q1 | % Diff 2023Q2 vs. 2023Q1 | % Diff 2022Q2 vs. 2022Q1 |
| Orlando-Kissimmee-Sanford, FL | 2251 | -54.9% | 66.9% | 44.5% | 12.6% |
| Philadelphia-Camden-Wilmington, PA-NJ-DE-MD | 937 | -28.1% | 18.9% | 27.9% | 72.7% |
| San Antonio-New Braunfels, TX | 420 | -27.3% | 8.3% | 57.7% | 19.2% |
| Charlotte-Concord-Gastonia, NC-SC | 970 | -54.8% | 178.3% | 35.6% | -19.8% |
| Las Vegas-Henderson-North Las Vegas, NV | 926 | -34.3% | 60.7% | -0.9% | -15.0% |
| San Francisco-Oakland-Fremont, CA | 1346 | 15.9% | 100.9% | 85.4% | 38.5% |
As noted earlier, the recent decline in permitting activity might reflect a range of headwinds, including compressed profit margins from softening rents and rising construction costs—pressures that have intensified with the tariffs on aluminum and steel. Furthermore, in June 2025, the administration doubled tariffs on steel and aluminum from 25% to 50%, signaling the potential for even greater cost escalation ahead, specifically for high-density multifamily projects. We will continue to monitor permitting trends to assess the evolving impact on multifamily development and the broader rental market.
Appendix: Rental Data–50 Largest Metropolitan Areas–July 2025
| Median Asking Rent | YoY | Six-Year Changes | # Permits for Buildings with 5+ Units, 2025Q2 | |
| Atlanta-Sandy Springs-Roswell, GA | 1,576 | -4.3% | 10.2% | 2408 |
| Austin-Round Rock-San Marcos, TX | 1,460 | -5.3% | 15.5% | 2706 |
| Baltimore-Columbia-Towson, MD | 1,827 | -0.1% | 15.1% | 691 |
| Birmingham, AL | 1,202 | -3.8% | 14.2% | 122 |
| Boston-Cambridge-Newton, MA-NH | 2,993 | -1.5% | 14.7% | 1396 |
| Buffalo-Cheektowaga, NY | NA | NA | NA | 104 |
| Charlotte-Concord-Gastonia, NC-SC | 1,519 | -1.5% | 15.6% | 970 |
| Chicago-Naperville-Elgin, IL-IN | 1,785 | -2.4% | 12.7% | 2270 |
| Cincinnati, OH-KY-IN | 1,312 | -4.4% | 15.5% | 408 |
| Cleveland, OH | 1,229 | -2.0% | 25.5% | 271 |
| Columbus, OH | 1,225 | -0.6% | 22.5% | 3473 |
| Dallas-Fort Worth-Arlington, TX | 1,458 | -2.6% | 15.4% | 8649 |
| Denver-Aurora-Centennial, CO | 1,783 | -7.7% | 7.3% | 2706 |
| Detroit-Warren-Dearborn, MI | 1,297 | -2.1% | 11.4% | 868 |
| Hartford-West Hartford-East Hartford, CT | NA | NA | NA | 158 |
| Houston-Pasadena-The Woodlands, TX | 1,352 | -3.6% | 8.4% | 3804 |
| Indianapolis-Carmel-Greenwood, IN | 1,298 | -2.9% | 30.6% | 833 |
| Jacksonville, FL | 1,499 | -4.3% | 26.0% | 804 |
| Kansas City, MO-KS | 1,404 | 3.2% | 27.4% | 1360 |
| Las Vegas-Henderson-North Las Vegas, NV | 1,471 | -2.9% | 22.8% | 926 |
| Los Angeles-Long Beach-Anaheim, CA | 2,751 | -3.2% | 11.7% | 3605 |
| Louisville/Jefferson County, KY-IN | 1,253 | -4.9% | 20.7% | 940 |
| Memphis, TN-MS-AR | 1,186 | -3.3% | 15.0% | 35 |
| Miami-Fort Lauderdale-West Palm Beach, FL | 2,332 | -2.9% | 36.3% | 5489 |
| Milwaukee-Waukesha, WI | 1,662 | -1.5% | 15.5% | 288 |
| Minneapolis-St. Paul-Bloomington, MN-WI | 1,514 | -2.6% | 3.1% | 1398 |
| Nashville-Davidson–Murfreesboro–Franklin, TN | 1,531 | -3.7% | 22.4% | 905 |
| New Orleans-Metairie, LA | 1,224 | -3.5% | 14.1% | 95 |
| New York-Newark-Jersey City, NY-NJ | 2,889 | 0.0% | 26.0% | 7166 |
| Oklahoma City, OK | 985 | -2.9% | 7.1% | 540 |
| Orlando-Kissimmee-Sanford, FL | 1,694 | -1.4% | 21.8% | 2251 |
| Philadelphia-Camden-Wilmington, PA-NJ-DE-MD | 1,771 | -2.7% | 9.1% | 937 |
| Phoenix-Mesa-Chandler, AZ | 1,491 | -5.4% | 23.5% | 3747 |
| Pittsburgh, PA | 1,490 | 2.3% | 42.3% | 340 |
| Portland-Vancouver-Hillsboro, OR-WA | 1,693 | -4.5% | 16.2% | 946 |
| Providence-Warwick, RI-MA | NA | NA | NA | 191 |
| Raleigh-Cary, NC | 1,498 | -4.6% | 24.0% | 1563 |
| Richmond, VA | 1,526 | -0.5% | 26.2% | 1016 |
| Riverside-San Bernardino-Ontario, CA | 2,040 | -5.7% | 14.6% | 1661 |
| Rochester, NY | NA | NA | NA | 50 |
| Sacramento-Roseville-Folsom, CA | 1,889 | -3.3% | 25.7% | 845 |
| St. Louis, MO-IL | 1,347 | -0.7% | 19.5% | 293 |
| San Antonio-New Braunfels, TX | 1,246 | -2.6% | 21.0% | 420 |
| San Diego-Chula Vista-Carlsbad, CA | 2,668 | -6.6% | 11.1% | 2636 |
| San Francisco-Oakland-Fremont, CA | 2,747 | -2.4% | -6.0% | 1346 |
| San Jose-Sunnyvale-Santa Clara, CA | 3,442 | 0.9% | 6.6% | 474 |
| Seattle-Tacoma-Bellevue, WA | 1,999 | -3.0% | 6.4% | 1376 |
| Tampa-St. Petersburg-Clearwater, FL | 1,741 | -0.2% | 39.5% | 2652 |
| Virginia Beach-Chesapeake-Norfolk, VA-NC | 1,516 | -2.2% | 19.9% | 38 |
| Washington-Arlington-Alexandria, DC-VA-MD-WV | 2,327 | 0.6% | 16.1% | 1708 |
Methodology
Rental data as of July 2025 for studio, 1-bedroom, or 2-bedroom units advertised for rent on Realtor.com. Rental units include apartments as well as private rentals (condos, townhomes, single-family homes). We use rental sources that reliably report data each month within the 50 largest metropolitan areas. Realtor.com began publishing regular monthly rental trends reports in October 2020 with data history stretching to March 2019.