
McDonald’s (MCD) stock is holding steady near $298, showing resilience despite mixed consumer trends and pricing pressures. Financially, the company remains strong with a market cap above $213 billion, a dividend yield of 2.37%, and nearly 50 consecutive years of dividend increases. Its Q2 earnings are expected on July 28, with analysts projecting modest profit growth.
Recently, Goldman Sachs upgraded MCD to “Buy,” citing its push to regain market share through product innovation and digital strategy. New menu items like the return of snack wraps and the “daily double” burger are designed to attract value-focused customers. McDonald’s is also expanding its beverage lineup, using insights from its CosMc’s concept to boost traffic and check size.
Leadership changes are underway too—Annemarie Swijtink will become CEO of McDonald’s Canada this September, signaling a fresh strategic direction in key markets. Overall, MCD is navigating a tough consumer environment with smart financial planning, brand strength, and targeted innovation. Want help turning this into a visual or social post? I’ve got ideas.
McDonald’s MCD weekly chart March 2025
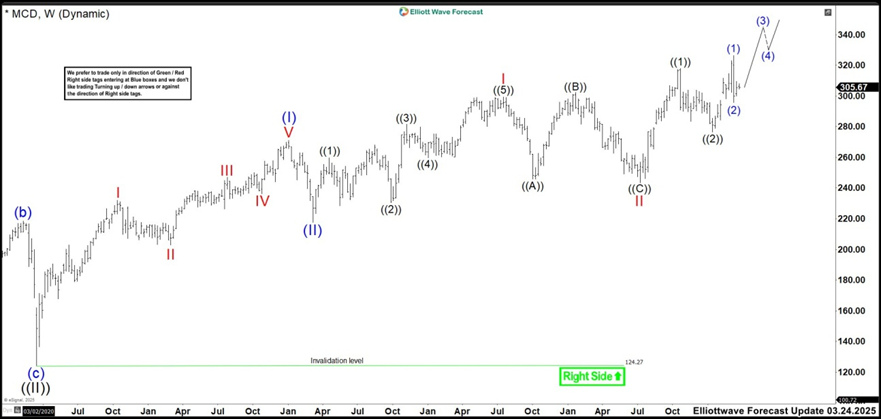
Back in March, McDonald’s (MCD) completed its correction and reached the projected zone between $281 – $271 area. It touched a low of $276.80 and quickly moved higher, matching our bullish forecast. Since then, the price climbed in a new upward phase, supported by strong momentum. As long as it stays above the previous low, the bullish setup remains valid. If the price dips below that level, it may signal that the correction isn’t over. However, that wouldn’t mean a bearish trend—just a delayed continuation. Overall, the market’s structure still points to more upside ahead.
McDonald’s MCD weekly chart July 2025
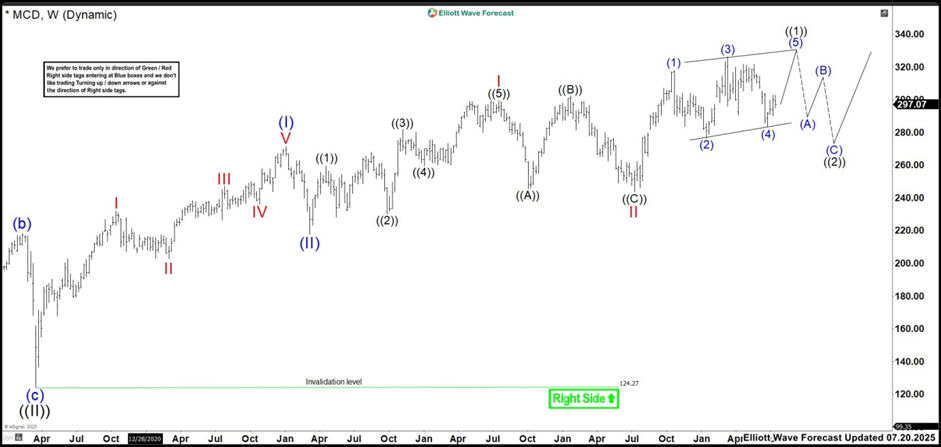
Currently, wave (2) has taken significantly more time than expected. Although we initially looked for a strong bullish continuation, we’ve now decided to relabel the structure as a leading diagonal. This adjustment stems from the likelihood that the Dow Jones is nearing to end of an impulsive move that began in April. If true, McDonald’s (MCD) stock should rally and soon experience a pullback. Accordingly, the diagonal now includes wave (1) at 317.84 high, correction wave (2) at 276.63 low, next leg at 326.27 high, and wave (4) at 283.47 low. To complete the pattern, wave (5) must rise above wave (3) but remain below 333.27.
If wave (5) exceeds 333.27, the diagonal structure becomes invalid. This is because wave (3) would then be the shortest, violating Elliott Wave rules. In that case, we must reassess whether MCD is forming a flat correction as wave ((2)), or simply continuing its bullish momentum. This scenario would require a fresh analysis of the broader structure and its implications for future price action. For now, we remain focused on completing the diagonal and preparing for a potential retracement.
FURTHER DISCLOSURES AND DISCLAIMER CONCERNING RISK, RESPONSIBILITY
AND LIABILITY
Trading in the Foreign Exchange market is a challenging opportunity where above average returns are available for educated and experienced investors who are willing to take above average risk.
However, before deciding to participate in Foreign Exchange (FX) trading, you should carefully consider your investment objectives, level of xperience and risk appetite. Do not invest or trade capital you cannot afford to lose. EME PROCESSING AND CONSULTING, LLC, THEIR REPRESENTATIVES, AND ANYONE WORKING FOR OR WITHIN WWW.ELLIOTTWAVE- FORECAST.COM is not responsible for any loss from any form of distributed advice, signal,
analysis, or content.
Again, we fully DISCLOSE to the Subscriber base that the Service as a whole, the individual Parties, Representatives, or owners shall not be liable to any and all Subscribers for any losses or damages as a result of any action taken by the Subscriber from any trade idea or signal posted on
the website(s) distributed through any form of social-media, email, the website, and/or any other electronic, written, verbal, or future form of communication . All analysis, trading signals, trading recommendations, all charts, communicated interpretations of the wave counts, and all content from any media form produced by www.Elliottwave-forecast.com and/or the Representatives are solely the opinions and best efforts of the respective author(s).
In general Forex instruments are highly leveraged, and traders can lose some or all of their initial margin funds. All content provided by www.Elliottwave-forecast.com is expressed in good faith and is intended to help Subscribers succeed in the marketplace, but it is never guaranteed. There is no “holy grail” to trading or forecasting the market and we are wrong sometimes like everyone else.
Please understand and accept the risk involved when making any trading and/or investment decision.
UNDERSTAND that all the content we provide is protected through copyright of EME PROCESSING AND CONSULTING, LLC. It is illegal to disseminate in any form of communication any part or all of our proprietary information without specific authorization.
UNDERSTAND that you also agree to not allow persons that are not PAID SUBSCRIBERS to view any of the content not released publicly. IF YOU ARE FOUND TO BE IN VIOLATION OF THESE RESTRICTIONS you or your firm (as the Subscriber) will be charged fully with no discount for one year subscription to our Premium Plus Plan at $1,799.88 for EACH person or firm
who received any of our content illegally through the respected intermediary’s (Subscriber in violation of terms) channel(s) of communication.